
Imagine you have been working from home for the last three days and your computer screen is burned into the back of your retina. It was great at first, but you just have to “get out” for some air. You leave your six-story apartment for the closest park.
The streets are so much busier in your local area now that apartments are sprouting up everywhere, coupled with the recent working from home trend. It is actually getting difficult to walk down the street. The local park is not far away but when you get there it is full of people and there are no seats. The walking paths are overflowing with people, kids on bikes, mothers with prams, walkers, talkers and more. You try a short run but spend more time dodging than running. You trudge back to the apartment not really fulfilled with the experience.
The lingering effects of Coronavirus have changed the structure of our working day and our leisure time. Workers and managers have realised the benefits of working from home. With the increased number of people now working from home on a more regular basis, demand has increased for locally accessible outdoor activity and exercise. The shortcomings of our existing urban infrastructure are becoming evident.
The massive increases in people exercising outdoors and using their local parks and public spaces, is what we have termed the “Coronacise” phenomenon (Coronavirus induced exercise). The pressure on our open spaces has illuminated the shortcomings of past planning. Planning that may not have adequately considered the capacity of our parks and public spaces to accommodate growth in population and demand.
Public open space and density
Increasing urban density in our town centres is amplifying the impact of this “shortcoming”. In Sydney, Melbourne and Brisbane, state level planning is specifying substantial densification within inner city areas and key centres. Increasing density can have many benefits as it makes better use of existing infrastructure, improves access to different transport options, adds vibrancy to our local areas and supports local economies. While planning for increased urban density has improved considerably in recent years, yet issues with public open space planning are still emerging.
The key concern is that higher density communities can be short changed. Existing parks and public spaces are often treated as if they were a “magic pudding”- endlessly able to meet the needs of an expanding population.
There are many things to consider with densification: “hard” infrastructure needs – water, schools, traffic, as well as “urban health infrastructure” – the spaces and places for people to reconnect with nature, get outdoors, exercise and maintain their well-being. Public open space often attracts strong “aspiration” in development strategies but poor delivery on the ground.
Past planning approaches did not really consider the issue of capacity. Early measures such as spatial standards (i.e. ha per 1000 people) were designed to ensure sufficient supply, but for areas where density was increasing, existing parks were often counted multiple times without any real assessment of the capacity of a public park to accommodate new demand. Additionally, standards (such as ha per 1000 residents or parks per 1000 people) often ignored the diminished capacity of the poor-quality land usually designated for park use.
Recently the Government Architect of NSW released their draft Greener Spaces Design Guide (https://bit.ly/3gsHlZv ). This is a landmark document for open space planners in several ways. Importantly, when planning open space for recreation, it advocates a performance approach that looks at the quality of the recreation outcome, acknowledges the importance of public place and space and includes assessment measures of capacity. It is a direct attempt to prevent the “magic pudding” approach [1].
Questioning Demand and Capacity
The impact of Coronacise has highlighted that capacity matters and raises important questions:
- What does peak demand look like?
- When is public open space at capacity?
- What measures can we use to assess capacity?
For organised sport, answers are relatively easy – rules based activity makes modelling user numbers simple, and the surface area needed is defined by the sport’s playing area dimensions.
For general recreation, exercise and outdoor activity – our outdoor “venues” have increasingly become the parks and pathways close to where we live. We have seen this shift coming, with the proliferation of boot camps and social exercise groups over the last few years. But, Coronacise accelerated this trend and highlighted new issues, particularly capacity, and the indications are, that much of this shift is here to stay.
The historical planning focus on having a “local park in walking distance” did get it partially right, but just “ticking the box” for a local park is not enough. As these changing times have emphasised, quality and capacity matter.
The impact of Coronacise and realisations regarding capacity are the same for our linear systems – our street footpaths, pathways through reserves and active recreation networks. Walking remains the top outdoor activity amongst Australians, yet the provision of safe and accessible footpaths, and shared use recreational paths in our public spaces has often been poor, with design dictated by budgets rather than any discussion of the peak capacity required. Imagine if we suggested that roads should be planned in this way!
Parks at peak
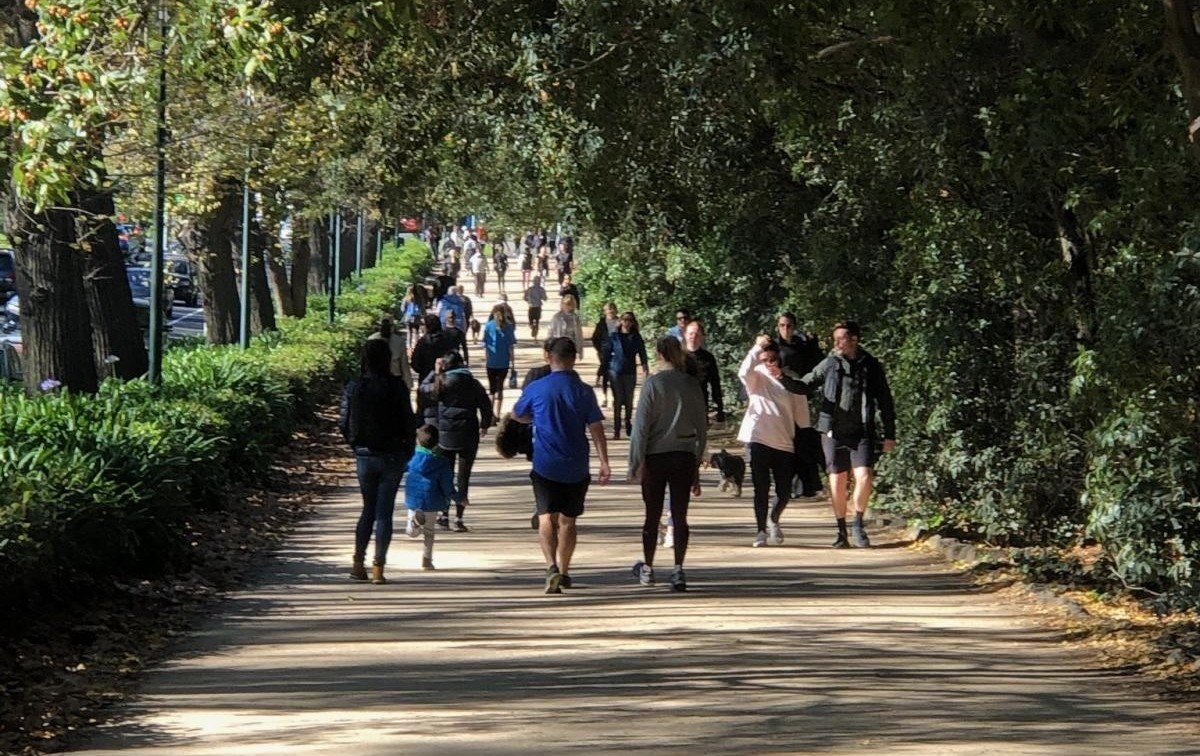
As Coronacise took off, our parks, pathways and linear open space networks experienced an explosion of use. In many cities, the challenge of trying to maintain social distance while exercising, walking, riding or running became an obvious issue. The overcrowding of public space was picked up in numerous news articles, commented on by planning ministers and, in some cases, enlightened local governments implemented road closures or lane closures to create additional capacity for increasing demand. Everyone noticed. Even more obvious, was that some of our larger open space areas had been planned around cars, not people, and the sudden spike in use highlighted that the priorities were upside down. It was space for bikes, strollers, runners and walkers that became important, not the number of car parks.
The overcrowding of parks and pathways, the traffic jams on trails, the spontaneous takeover of streets for physical activity, is telling us we need a better approach.
A possible approach?
In pondering the issue of measuring capacity, we realised that Coronavirus offered an opportunity to test a worst case. During the lockdown, going out required 1.5m of “safe” space around us. That equates to a circle of personal space around 7m2. Adopting this minimum of 7m2 per person provides a starting point to “roughly” model capacity. Importantly, this assessment of capacity is primarily focused on locally accessible public open space – the parks within walking distance. It is not a measure of overall public open space need.
If we model a local park within 400m walking distance that serves a surrounding population. At average densities of 30-50 people per hectare, that could mean a population of between 1500-2500 residents trying to access the same local park [1]. If at peak times (say Friday afternoon), a majority were getting out for their walk or exercise then a conservative estimate might be between 840-1400 users at once [2].
If we ensure each user has 7m2, that means that between 5,880m2 and 9,800m2 of space will be needed. In broad terms between 0.6 and 1 ha is needed, more than many local parks provide. Many green field master plans or urban redevelopment plans for increased density, propose smaller minimum areas for local parks, often less than 5000m2 with some as low as 1000 or 2000m2. Ironically, the constraints of higher density development are often used to justify smaller park areas!
This is merely a general assessment and yet, the reality is probably worse. Consider three other factors:
- No park is perfect. Very few can deliver 100% of useable accessible space. In fact, quite often local parks will be constrained by slope, size, shape, multiple use features such as storm water treatments, creeks, vegetation, inaccessible portions and space that lacks visibility and a sense of safety.
- Safe walking and cycling access are highly variable. There are multiple barriers and constraints that can impact safe access. This includes geography, transport corridors and urban design.
- The double count. The tendency for planners to assume that an existing park, in or adjacent to a planned higher density area, has capacity because it is within walking distance, rather than considering the size of the population it already services.
It’s true that not everyone is going out on the same evening, but it is equally true that many people exercise several times a week and with Coronacise we saw an increase of people going out to exercise – every afternoon or every morning. In Australia 63% of adults were exercising outdoors three times a week before the lockdown [3], anecdotally this has increased substantially and by all indications, the increased activity is sticking around, behaviours have changed.
Path and track network capacity
The other key piece of urban health infrastructure is the paths, tracks and trails that provide the valuable connections to the spaces we use for recreation and support active recreation on their own. How do we assess capacity of these linear systems?
Pathway widths vary considerably and are reflective of the surrounding corridor (and past budgets). They can be narrow 1m strips, or luxurious 5m promenades. Mostly they are 1.8m or 2.5-3m for a shared path. Most public health guidelines would advocate for a minimum 30 minute “vigorous” walk on most days of the week. In Australia, 48% walk for 30-60 minutes and a further 23% walk for 60-90 minutes [1]. If an average walker has a speed of around 5km/h then they will need around 3km of walking distance for their minimum 30 minutes.
Path use is complicated, with speed variation, two-way traffic, runners passing walkers, strollers etc. If we retain the 1.5m “safe distance”, we need 3 linear metres per person as a minimum requirement. There is an added complication of providing sufficient width to ensure “safe passing space” for two-way traffic (note some councils implemented “one-way walking” as Coronacise peaked).
Using 3m/person, 1km of shared path would have a peak capacity of around 334 people. Most people would find this a very crowded path, especially when you add in the mix of activities, groups and speeds. This also assumes a minimum overall corridor width of at least 3m to allow safe passing.
For a neighbourhood of 5000 people wanting their daily 30 minute walk or run and assuming 50% at the same time needing a minimum of a 3km loop or “there and back” path, peak demand could require around 8-9km of paths and walking links. This is, of course, simplified and the reality is far more complex and, we suspect, less accommodating especially when considering the diversity of users and speeds.
Bicycle boom times
Over recent months bike shops have sold out of stock as the public showed unprecedented interest in cycling. Coronacise seems to be responsible for a huge surge in cycling, running, strollers, scooters and skaters – all looking for a path somewhere.
This surge saw a lot more cyclists on the car-free street network. However, as the traffic returned the critical lack of safe cycling infrastructure was exposed. Many people put their bikes back in their garage and kids returned to biking on the street footpath which added to the capacity problems.
Many people loved the experience of cycling for exercise, going to the park or their local shops. Clearly, in the future, there needs to be a focus on improving cycling connections to the larger urban parks that provide space for people to ride and get their daily exercise. The increase in cycle commuting has also been significant, but that’s another story.
More work is needed here, as there are many factors influencing use of paths and trails. However, the spatial implication is clear – we need car free active transport networks for recreation and exercise, we need sufficient distance, and we need the width to accommodate use safely and effectively. Importantly, we need to understand capacity so we can plan effectively to accommodate increased demand and encourage physical activity and greater well-being.
We especially need to stop thinking of bikeways and pathways as just “connectors”. They are active recreation assets in their own right. Infrastructure with a growing demand and a finite capacity.
Better planning
Coronacise has highlighted a less exposed planning issue and has provided an opportunity to illustrate the problem. Our neighbourhoods suddenly had less cars, and more people outside. The thousands of locals looking for space to exercise put the spotlight on the shortcomings of urban and open space planning and has shown the dangers of a “magic pudding” approach that ignores capacity.
It also seems to have brought many to the realisation that a fundamental basis of successful cities is public open space and active transport networks for recreation. This critical infrastructure should underpin our urban planning. Central to this is an understanding of demand and capacity. Otium Planning Group and MR Cagney have begun collaboration on the development of demographic and spatial analysis tools to improve this understanding. If you would like to contribute or know more, please contact the authors.
Martin Lambert (Otium Planning Group) via email to martin@otiumplanning.com.au
Scott Ebbett (MR Cagney) via email to sebbett@mrcagney.com
[1] Authors disclosure- Martin Lambert was a contributor to this document.
[2] A 400m radius covers around 50ha
[3] Ausplay data (accessed June 2020-power BI portal) indicates adult participation is walking 43.4%, jogging/running 15.5% and cycling 11.5% = a total of around 70% of the population. Of these 82% participate once per week or more often. 25% of walkers are walking once or more per day and 49% are 4+ times a week.
[4] [5] Ausplay data op.cit